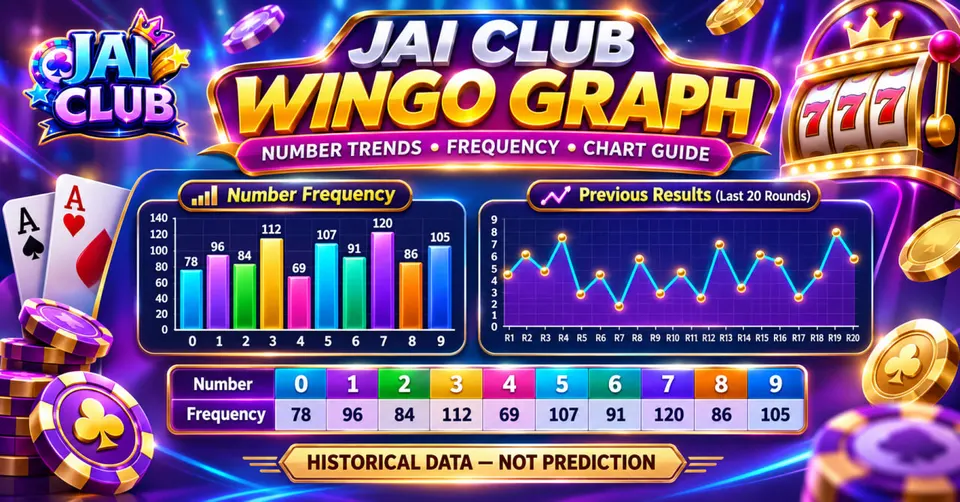
Why the Most Frequent WinGo Number Isn't Always the Most Likely
Understand why a frequently appearing WinGo digit does not automatically have a higher chance in the next round. Includes clear examples of number frequency, probability and small-sample variation.
In this article
- What Is WinGo Number Frequency?
- WinGo Number Probability Kaise Calculate Hota Hai?
- Frequency vs Probability Explained
- Hot Numbers Aur Cold Numbers Kya Hain?
- Why Small Samples Look Uneven
- What Happens With a Larger Sample?
- Does a Frequent Number Become More Likely?
- Missing Number Ka Matlab Kya Hai?
- What Is the Gambler's Fallacy?
- Can a Result Chart Detect Bias?
- WinGo Frequency Me Sample Size Kyun Important Hai?
- Can Two Charts Show Different Frequencies?
- Why Frequencies Do Not Guarantee Prediction Accuracy
- Number Probability vs Big Small Probability
- A Simple Frequency Calculation Example
- Frequently Asked Questions
- What is the most frequent WinGo number?
- Kya Hot Number Next Round Me Aayega?
- Does a missing number become more likely?
- Is WinGo digit probability always 10%?
- Can a frequency chart prove a prediction tool works?
- Does a larger sample guarantee the next result?
- Is Big/Small prediction the same as exact-digit prediction?
- Conclusion
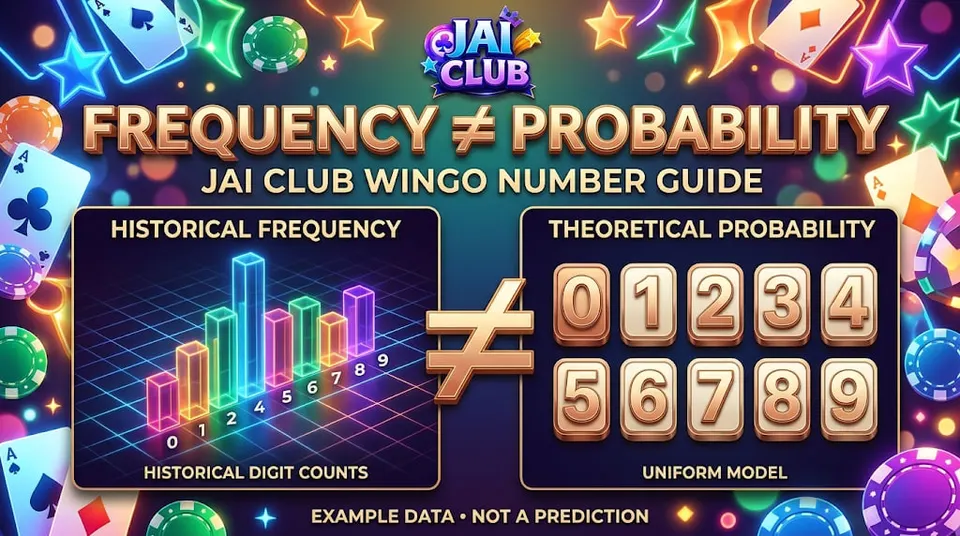
The most frequent WinGo number in a result chart is not automatically the number most likely to appear next. Frequency describes how often a digit appeared in the recorded history. Probability describes the likelihood of an outcome under a particular mathematical model.
This difference is important because short samples often contain uneven counts. One digit may appear several times while another does not appear at all. Such a pattern can look meaningful without showing that the underlying probabilities have changed.
This guide explains Jai Club WinGo number frequency using fictional examples, basic mathematics and clear assumptions. It does not claim access to the actual random-number system of a particular Jai Club game.
What Is WinGo Number Frequency?
Frequency is the number of times a result appears within a defined set of completed rounds.
For example, suppose a fictional ten-round sample contains:
7, 2, 7, 4, 1, 7, 9, 3, 5, 0
The digit 7 appears three times. Its frequency count is three.
The other displayed digits appear once, while 6 and 8 do not appear.
This tells us what happened in the ten recorded rounds.
It does not tell us whether the next result will be 7, 6, 8 or another digit.
WinGo Number Probability Kaise Calculate Hota Hai?
Probability requires a defined outcome model.
Under a hypothetical model where one digit is selected independently and uniformly from 0 through 9, there are ten possible outcomes.
The probability of one specified digit is:
1 ÷ 10 = 0.10 = 10%
This calculation would apply to each digit under the stated assumptions.
However, it should not be presented as a verified probability for a particular Jai Club implementation unless the provider's actual result-generation rules support it.
The key point is that theoretical probability comes from the model, not the number of times a digit appeared recently.
Frequency vs Probability Explained
Frequency and probability are related but different.
| Measurement | Meaning | Example |
|---|---|---|
| Frequency count | Number of recorded occurrences | Digit 7 appeared 3 times |
| Sample frequency | Occurrences divided by sample size | 3/10 = 30% |
| Theoretical probability | Chance under an assumed model | 10% in a uniform ten-digit model |
| Future result | Actual next outcome | Not known from the sample |
A digit can have a sample frequency of 30% while the hypothetical model assigns it a 10% probability on the next independent round.
There is no contradiction.
Sample frequencies naturally vary because a small data set does not always mirror the underlying probability exactly.
Hot Numbers Aur Cold Numbers Kya Hain?
Some result-analysis websites describe frequently appearing digits as hot numbers.
Digits appearing rarely or not at all may be called cold numbers.
These are informal descriptions of historical frequency.
They do not establish that a hot number will continue appearing or that a cold number must appear soon.
For example, the digit 7 in our fictional sample could be labelled hot because it appeared three times.
The digits 6 and 8 could be described as cold because neither appeared.
Under an independent uniform model, all three would still have the same chance in the next round.
Why Small Samples Look Uneven
A sample of ten rounds contains only ten observations.
Even when ten possible digits have equal theoretical probabilities, some can repeat while others are absent.
It is not necessary for every digit to appear exactly once.
Randomness does not require perfect balance over each short sequence.
For example, a sequence with three occurrences of 7 is possible under a uniform model.
A reader should not automatically conclude that the game favours 7 merely because this pattern occurred.
What Happens With a Larger Sample?
As the number of observations increases, sample frequency may provide a more stable estimate of an underlying constant probability, provided the assumptions are appropriate.
For example, one occurrence changes a frequency calculation by ten percentage points in a ten-result sample.
In a one-thousand-result sample, one occurrence changes the sample frequency by only 0.1 percentage points.
This demonstrates why small samples are more sensitive to individual results.
However, even a large sample cannot establish future predictability if the outcomes are independent and the true probability remains fixed.
It may also fail to describe the underlying model if the data is incomplete or combines different game modes.
Does a Frequent Number Become More Likely?
Not under an independent, uniformly distributed ten-digit model.
Suppose digit 7 appeared in three of the previous ten rounds.
Its historical frequency would be 30%.
But under our hypothetical independent model, its probability in the next round remains 10%.
The previous outcomes do not change that probability.
A real game could follow a different model, but its behaviour would need to be established through reliable technical information rather than assumptions based on a few recent numbers.
Missing Number Ka Matlab Kya Hai?
A missing-number count commonly describes how many completed rounds have passed since a particular digit last appeared.
For example, a chart might show that digit 6 has not appeared in twenty rounds.
That is a historical observation.
It does not mean the system owes a result of 6.
In an independent model, past absence does not automatically increase the probability of the digit appearing next.
The belief that a long absence makes an outcome due is a common example of the gambler's fallacy.
What Is the Gambler's Fallacy?
The gambler's fallacy is the mistaken belief that past independent outcomes force future outcomes to balance immediately.
For example, someone may see five Big results and assume the next result must be Small.
But if each round is independent and the Big/Small probabilities remain unchanged, the earlier sequence does not determine the next outcome.
The same reasoning applies to individual digits.
Several occurrences of one number do not guarantee that a different number must follow.
Likewise, a long absence does not guarantee an overdue result.
Can a Result Chart Detect Bias?
Historical data can sometimes be used to investigate whether observed outcomes are consistent with a proposed probability model.
However, detecting a genuine difference requires more than counting a few results.
The analysis should use a suitable sample, a clearly defined expected distribution and an appropriate statistical test.
A deviation can occur through normal sampling variation.
The data source must also be complete, because missing records or mixed WinGo modes can distort the analysis.
A simple frequency chart cannot, by itself, prove that a game is biased or predictable.
WinGo Frequency Me Sample Size Kyun Important Hai?
Suppose two fictional analysts examine different samples.
Analyst A sees digit 7 three times in ten rounds.
Analyst B sees digit 7 ninety-nine times in one thousand rounds.
The first sample has an observed frequency of 30%. The second has an observed frequency of 9.9%.
Neither should be interpreted without considering sample size and the model being tested.
The two values may differ because of normal sampling variation, different source records or different underlying conditions.
Comparing percentages without their observation counts can be highly misleading.
Can Two Charts Show Different Frequencies?
Yes.
A ten-round chart and a hundred-round chart can report different percentages for the same digit.
Charts may also cover different round-duration modes.
Some interfaces include only completed periods, while others may contain incomplete or duplicate entries.
A frequency comparison must use compatible data.
For background on interpreting records, read What Do WinGo Game Records Actually Show?.
Why Frequencies Do Not Guarantee Prediction Accuracy
A common prediction method selects whichever digit appeared most frequently in the previous sample.
However, this method assumes that recent frequency provides useful information about the next result.
That assumption is not justified in an independent uniform model.
The method may occasionally produce correct predictions through chance.
Successful predictions alone do not establish a reliable advantage.
A genuine evaluation would need a complete record of forecasts made before outcomes became known.
Number Probability vs Big Small Probability
An exact digit and a Big/Small category have different outcome spaces.
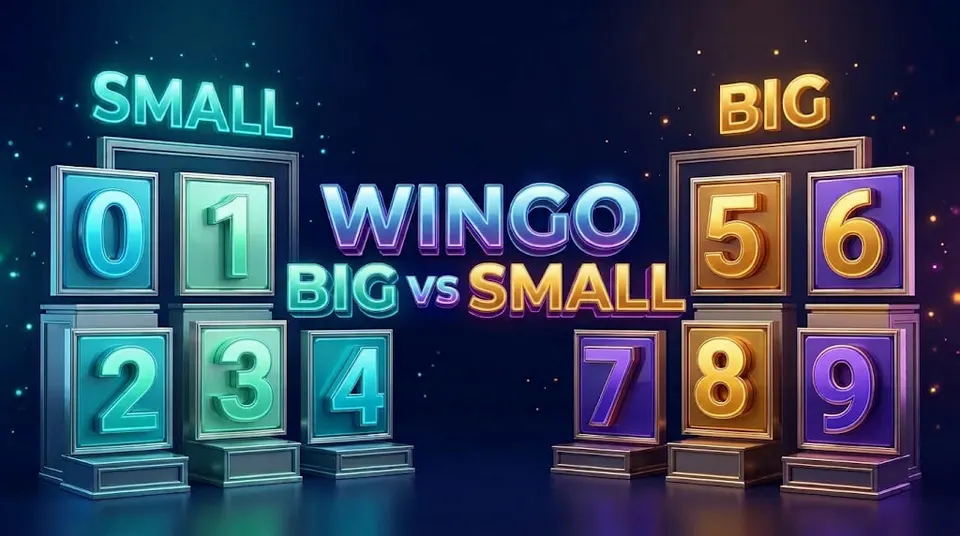
In a common format, Small covers 0–4 and Big covers 5–9.
Under a hypothetical uniform ten-digit model, the probability of one specific digit is 10%.
The probability of either five-digit category is 50%.
A model predicting a category should therefore not compare its accuracy directly with a model predicting one exact digit.
The tasks have different baseline probabilities.
The WinGo Big Small guide provides additional background on result groupings.
A Simple Frequency Calculation Example
Suppose a fictional sample contains twenty completed results and digit 3 appears four times.
The sample frequency is:
4 ÷ 20 × 100 = 20%
The result tells us that one-fifth of the recorded sample contained digit 3.
It does not mean that digit 3 will appear in one-fifth of the next five rounds.
A long-term model might suggest a theoretical probability, but individual short sequences can deviate substantially from that expectation.
Frequently Asked Questions
What is the most frequent WinGo number?
It depends on the historical data set and period being examined. There is no permanently most frequent digit established by this guide.
Kya Hot Number Next Round Me Aayega?
A hot number is simply one that appeared frequently in the selected history. It is not guaranteed to appear next.
Does a missing number become more likely?
Not merely because it has been absent, if the rounds are independent and probabilities remain unchanged.
Is WinGo digit probability always 10%?
Ten percent follows from a hypothetical independent uniform 0–9 model. The actual provider's rules must be verified.
Can a frequency chart prove a prediction tool works?
No. Forecasting performance requires separate testing using complete predictions and outcomes.
Does a larger sample guarantee the next result?
No. A larger sample can improve descriptive estimates without making an individual future result certain.
Is Big/Small prediction the same as exact-digit prediction?
No. They have different possible outcomes and baseline probabilities.
Conclusion
The most frequent WinGo number in a chart is a description of the past, not automatically the best forecast for the future.
Frequency, sample size and theoretical probability answer different mathematical questions. Treating them as interchangeable can lead to misleading conclusions about hot numbers, cold numbers and missing digits.
The most reliable approach is to understand the assumptions behind a calculation and avoid claiming that historical counts guarantee future outcomes.
Editorial method: Every example in this article uses fictional data and clearly stated probability assumptions. It does not claim to establish the actual result-generation probabilities of a Jai Club platform.
Disclaimer: JaiClubGame.online is an independent educational website and does not provide guaranteed game predictions.