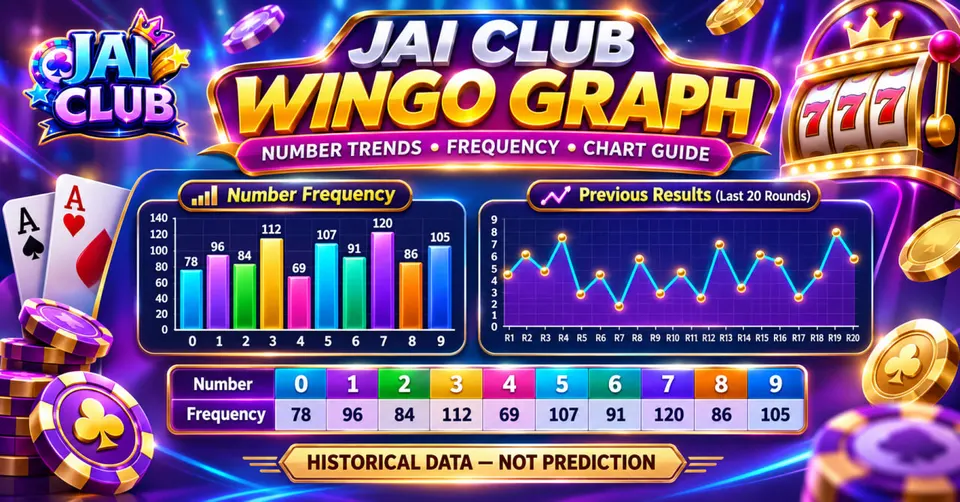
Jai Club WinGo Graph Kaise Read Kare? Number Trends, Frequency & Chart Guide
Learn how to read WinGo graph displays, number frequency, trend lines, missing numbers and result charts without confusing historical patterns with reliable predictions.
In this article
- WinGo Graph Kaise Read Kare?
- WinGo Number Range: 0 to 9
- Number Frequency Ka Matlab Kya Hai?
- Example WinGo Frequency Table
- Missing Number Aur Frequency Me Kya Difference Hai?
- What Is a WinGo Trend Line?
- Big Small Graph Me Kya Dikhaya Jata Hai?
- Colour Graph vs Number Graph
- What Does Average Missing Mean?
- Why the Sample Size Matters
- Can WinGo Graphs Predict Future Results?
- Avoid Mixing Different WinGo Modes
- WinGo Graph vs Result History
- Frequently Asked Questions
- What is a Jai Club WinGo graph?
- WinGo Graph Me Frequency Kya Hai?
- What does Missing mean?
- Does a high missing count guarantee a result?
- Can a WinGo graph predict numbers?
- Why do charts show different numbers?
- Is a trend line the same as the next result?
- Conclusion
A Jai Club WinGo graph is a visual way to organise previous number results. Instead of reading a long list of completed rounds, a graph can show number frequency, missing-number counts and how recorded digits change across a selected period.
However, a graph describes what has already happened. It does not automatically reveal which number will appear next. A number appearing frequently in earlier rounds is not guaranteed to continue appearing, and a missing number is not necessarily due.
This guide explains common WinGo graph elements, their mathematical meaning and how to avoid confusing a historical trend with a prediction formula. Exact graph layouts may differ between platforms.
WinGo Graph Kaise Read Kare?
Start by identifying what each row and column represents.
A typical result chart may include a completed period number, the recorded digit and additional information such as colour or Big/Small classification.
A graph can organise that information by placing periods along one axis and digits along another.
If numbers are connected with lines, the line shows how the recorded values changed between those particular rounds.
The first step is to understand the chart legend. Without clear labels, a rising line could represent several different things, including result values, frequency or another calculated measure.
WinGo Number Range: 0 to 9
In a commonly described WinGo format, each completed round produces one primary digit from 0 through 9.
That gives ten possible numerical labels:
0, 1, 2, 3, 4, 5, 6, 7, 8 and 9.
A chart may show these digits vertically while completed rounds are arranged horizontally.
For example, a fictional result sequence could be:
2, 7, 4, 7, 1, 9, 7, 3, 0, 5.
This sequence contains ten results. It is an educational example, not live Jai Club data.
The digit 7 appears three times. Every other displayed digit appears once, except 6 and 8, which do not appear.
Number Frequency Ka Matlab Kya Hai?
Frequency tells us how many times a particular result appears within a selected sample.
For example, in the ten-round sample above, number 7 appears three times.
Its observed frequency is therefore 3 out of 10, or 30%.
This is a historical observation. It does not mean that the probability of number 7 in the next independent uniform draw has increased to 30%.
A sample frequency and a true underlying probability are different measurements.
A frequency table is useful for summarising the selected history, but its interpretation depends on how many rounds were included and whether the game's probability model is known.
Example WinGo Frequency Table
| Digit | Times observed | Sample frequency |
|---|---|---|
| 0 | 1 | 10% |
| 1 | 1 | 10% |
| 2 | 1 | 10% |
| 3 | 1 | 10% |
| 4 | 1 | 10% |
| 5 | 1 | 10% |
| 6 | 0 | 0% |
| 7 | 3 | 30% |
| 8 | 0 | 0% |
| 9 | 1 | 10% |
The total equals ten observations.
This table describes only the fictional sample. It must not be presented as an actual game frequency report.
Missing Number Aur Frequency Me Kya Difference Hai?
Frequency counts how often a number appeared.
A missing-number indicator may count how many completed rounds have passed since that number last appeared.
For example, if digit 4 last appeared six rounds ago, a chart might show a missing count of 6.
However, the counting convention can vary by software. Some charts count the rounds after the last occurrence; others display the gap differently.
A large missing count does not prove that the number must appear next.
In independent random events, previous absence does not create a debt that the next result must repay.
What Is a WinGo Trend Line?
A trend line is a graphical connection or summary of recorded values.
Some interfaces connect each digit to the next, creating a zigzag line.
A line moving upwards simply means the numerical value increased between those displayed observations.
For example, moving from 2 to 7 is an increase of five units. Moving from 7 to 4 is a decrease of three units.
That movement describes historical values, not a forecast.
The line's direction cannot be treated as a reliable signal that the next digit will be higher or lower.
Big Small Graph Me Kya Dikhaya Jata Hai?
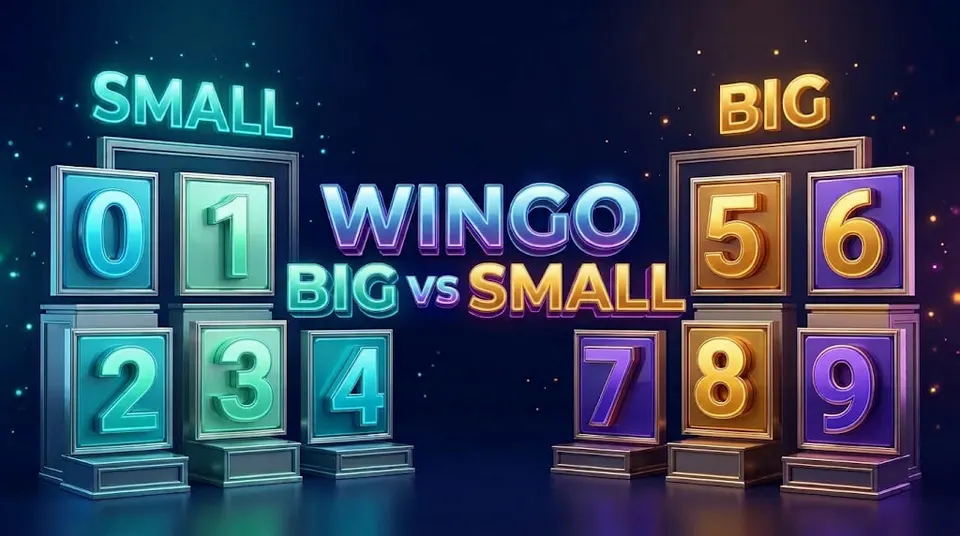
Some WinGo formats classify digits into Big and Small groups.
A common convention labels 0–4 as Small and 5–9 as Big.
Under that convention, the sample result sequence can be converted into a series of Big and Small classifications.
However, this is another way of describing the same underlying digits.
It does not create a separate source of independent evidence about future outcomes.
A long sequence of Big results can occur without making the next result guaranteed to be Small.
For more background, see the WinGo Big Small guide.
Colour Graph vs Number Graph
A colour graph may group results under Red, Green and Violet labels according to the game's rules.
A number graph displays numerical digits.
The two presentations can be related, because a digit may determine its colour classification.
However, exact mappings depend on the version. Special treatment of digits such as 0 and 5 can differ between interfaces.
Readers should check the stated colour rules rather than apply a mapping copied from another website.
What Does Average Missing Mean?
Some statistical charts use a field called Average Missing.
It may summarise the average number of rounds between appearances of a selected result across historical data.
However, its calculation depends on the data set and the chart provider's definition.
For example, averages can be affected by the selected observation window and by whether the chart includes incomplete gaps at the beginning or end.
A displayed average is not a promise that a future gap will match that value.
Without a published calculation method, the figure should be treated as a software-specific statistic.
Why the Sample Size Matters
A graph based on ten completed rounds contains less information than a graph based on one thousand rounds.
Small samples can show large fluctuations in observed frequency even when the underlying probability remains constant.
For example, seeing one digit appear three times in ten rounds does not, by itself, establish a biased game.
To evaluate a probability claim, the full sampling method, expected distribution and statistical uncertainty must be considered.
The presence of colourful patterns is not sufficient evidence.
Can WinGo Graphs Predict Future Results?
A historical graph is not a verified prediction engine.
If a game uses independent, uniformly distributed digits, the theoretical chance of any particular digit remains one in ten for each round.
The previous graph does not alter that probability.
A real game might use a different model, but its actual rules would need to be verified before making probability statements.
Prediction websites sometimes advertise graph formulas without disclosing reliable evidence of predictive accuracy.
Those claims should not be accepted merely because the chart appears technical.
Avoid Mixing Different WinGo Modes
A WinGo platform may present separate round-duration modes.
A graph containing results from one mode should not be confused with a chart from another mode.
The periods, timing and histories may differ.
For a valid comparison, identify the exact game mode and the completed round sequence.
A chart that combines unrelated data without clear labels can be misleading.
WinGo Graph vs Result History
A result history is the underlying sequence of recorded outcomes.
A graph is a visual representation or summary of those outcomes.
A graph may also add calculated statistics such as frequency or missing counts.
These additions make the history easier to examine, but they do not change the underlying events.
The detailed WinGo Game Records guide provides a broader starting point for related result terminology.
Frequently Asked Questions
What is a Jai Club WinGo graph?
It is a visual representation of previous WinGo numbers and related statistics.
WinGo Graph Me Frequency Kya Hai?
Frequency is the number of times a digit appears within a chosen sample.
What does Missing mean?
It usually describes the gap since a result last appeared, according to the chart's counting method.
Does a high missing count guarantee a result?
No. Historical absence does not guarantee the next outcome.
Can a WinGo graph predict numbers?
A graph alone does not establish a reliable predictive method.
Why do charts show different numbers?
They may cover different modes, time windows or data sources.
Is a trend line the same as the next result?
No. A trend line describes recorded values.
Conclusion
A Jai Club WinGo graph can help readers understand recorded digits, frequency counts, missing numbers and historical chart patterns.
The key is to separate descriptive statistics from predictions. A graph can show what happened, but it cannot independently guarantee what will happen next.
Sources and method: The calculations in this article use a fictional ten-result sample and standard arithmetic. No live Jai Club result feed was accessed or independently audited.
Disclaimer: JaiClubGame.online is an independent educational website. The article does not provide guaranteed predictions or verified current results.