K3 Dice Total Chart: Numbers 3–18 in Jai Club
Explore K3 dice totals from 3 to 18, the number of possible combinations for each sum, Odd Even results, Doubles, Triples and theoretical probabilities.
In this article
- What Is a K3 Dice Total?
- Complete K3 Dice Total Chart: 3 to 18
- Why Are Totals 10 and 11 the Most Common in the Model?
- What Is the Difference Between Dice Numbers and Total Numbers?
- Odd and Even K3 Totals
- How Doubles and Triples Affect the Result
- Why the K3 Chart Is Different From 5D SUM
- Can a K3 Dice Total Chart Predict the Next Round?
- Frequently Asked Questions
- What is the minimum K3 total?
- What is the maximum K3 total?
- How many ordered outcomes are possible with three dice?
- Which totals have the most possible combinations?
- Are totals 3 and 18 equally likely?
- Can different dice arrangements have the same sum?
- Can a K3 total chart predict the next result?
- Conclusion
Jai Club K3 total chart is a useful mathematical reference for understanding how three dice combine to produce a result between 3 and 18. In a standard three-dice model, each die has six faces numbered 1 through 6. The combined total is calculated by adding the three displayed values, meaning the lowest possible sum is 3 and the highest is 18.
Although there are only sixteen possible total values, those values do not all have the same number of combinations. A total of 3 requires three dice showing 1, whereas a total such as 10 can be formed through many different arrangements. This difference is important because a chart of possible sums is not the same as a list of equally likely outcomes.
This guide explains all possible K3 totals, the mathematical frequency of each sum, how Odd and Even classifications work, and how Doubles and Triples relate to individual dice. All probability calculations assume three independent, fair six-sided dice rather than a verified Jai Club result-generation system.
What Is a K3 Dice Total?
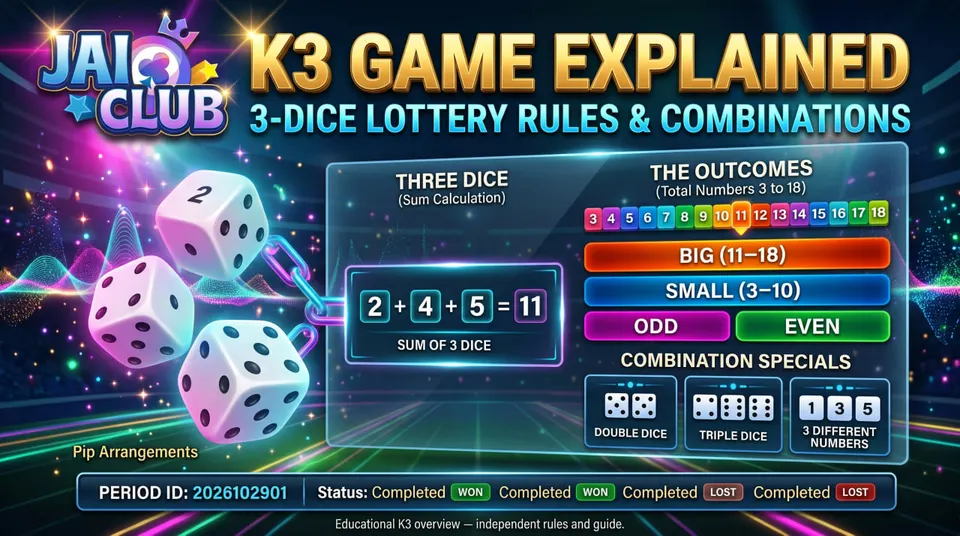
A K3 total is the sum of the values displayed by three dice in a completed round. For example, dice showing 2, 4 and 5 produce a total of 11. Dice showing 6, 6 and 3 produce a total of 15. The individual faces describe the component result, while the sum provides one additional numerical value.
Three six-sided dice produce 216 possible ordered outcomes because each die has six possibilities, giving 6 × 6 × 6 combinations. An ordered outcome distinguishes between the positions of the dice. For example, 1–2–3 and 3–2–1 are different ordered results even though both have a total of 6.
This distinction explains why a K3 total chart describes the distribution of sums across a larger set of possible dice arrangements. For a general introduction, read the Jai Club K3 Game overview.
Complete K3 Dice Total Chart: 3 to 18
Under the standard fair-dice model, the theoretical number of ordered combinations for each total is as follows.
| Total | Combinations | Probability |
|---|---|---|
| 3 | 1 | 0.46% |
| 4 | 3 | 1.39% |
| 5 | 6 | 2.78% |
| 6 | 10 | 4.63% |
| 7 | 15 | 6.94% |
| 8 | 21 | 9.72% |
| 9 | 25 | 11.57% |
| 10 | 27 | 12.50% |
| 11 | 27 | 12.50% |
| 12 | 25 | 11.57% |
| 13 | 21 | 9.72% |
| 14 | 15 | 6.94% |
| 15 | 10 | 4.63% |
| 16 | 6 | 2.78% |
| 17 | 3 | 1.39% |
| 18 | 1 | 0.46% |
| Total | 216 | 100% before rounding |
The probabilities above are rounded to two decimal places and represent a mathematical model. They should not be interpreted as verified odds or payout rates for a particular Jai Club K3 implementation.
Why Are Totals 10 and 11 the Most Common in the Model?
Totals near the middle of the range can be produced through many different arrangements of dice. For example, the total 3 requires the result 1–1–1, leaving only one ordered possibility. The total 18 similarly requires 6–6–6.
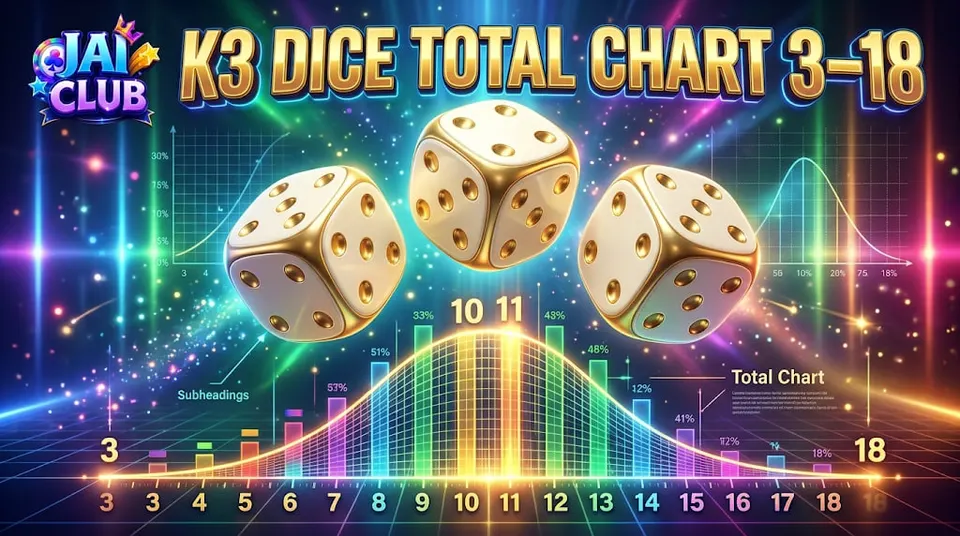
By comparison, a total of 10 can be reached by several different groups of values and multiple rearrangements of those values. When all ordered combinations are counted, there are 27 ways to obtain 10 and 27 ways to obtain 11. Each therefore represents 27 out of 216 theoretical outcomes, or 12.5%.
The overall chart has a symmetrical pattern. Totals at opposite ends of the range have matching frequencies, while those closer to the middle have more possible combinations. This symmetry is a property of the standard fair-dice model and does not guarantee the result of any individual round.
What Is the Difference Between Dice Numbers and Total Numbers?
The three individual dice values describe the underlying result. Their total is calculated by adding them together. This means that several different dice arrangements can produce exactly the same sum without being identical results.
For example, 1–4–6 and 2–3–6 both produce a total of 11. The two results have different values in the first and second dice positions, but their combined sum is equal.
This matters when interpreting result-history charts. A table showing only totals does not reveal the complete three-dice arrangement. If a game separately evaluates matching faces or other patterns, the individual dice values are required to identify those features.
Odd and Even K3 Totals
Odd and Even classify the combined total using ordinary mathematics. A total is Even if it is divisible by two without a remainder, and Odd otherwise. Under this definition, totals 4, 6, 8, 10, 12, 14, 16 and 18 are Even, while 3, 5, 7, 9, 11, 13, 15 and 17 are Odd.
The classification does not mean every die in an Even result must show an even number. For example, 1–3–4 produces the Even total 8, while 1–2–4 produces the Odd total 7.
In the standard fair independent model, 108 ordered outcomes produce Even totals and 108 produce Odd totals. This mathematical balance does not imply that consecutive results must alternate between the two classifications.
How Doubles and Triples Affect the Result
A Double occurs when at least two dice show the same face, while a Triple occurs when all three dice match. For example, 2–2–5 contains a pair, and 4–4–4 is a Triple. These labels describe the arrangement of the component dice rather than the sum alone.
Two outcomes may share the same total while having different matching patterns. For instance, 2–2–5 totals 9 and contains a pair, whereas 1–3–5 also totals 9 but has three different faces.
For a more detailed discussion of matching combinations, visit K3 Dice Combinations: Doubles, Triples & Total Results. This article is already live and provides a useful companion to the total chart.
Why the K3 Chart Is Different From 5D SUM
K3 commonly uses three dice with values from 1 to 6, whereas the usual 5D format uses five number positions containing digits from 0 to 9. K3 totals therefore range from 3 to 18, while a conventional 5D SUM can range from 0 to 45.
The probability distributions of the two systems are different because the number of components and possible values differ. A chart designed for three dice cannot be used to explain five-digit totals.
Readers exploring both formats can compare them in the Jai Club K3 & 5D category, where the general structure of these number games is discussed.
Can a K3 Dice Total Chart Predict the Next Round?
A mathematical chart describes the relative number of possible outcomes under a given set of assumptions. It does not identify the next result. Even though totals 10 and 11 are more common than 3 or 18 in the fair-dice model, neither is guaranteed during the next roll.
Likewise, a rare total that has not appeared recently does not become certain to appear in the following round. Independent random outcomes do not carry an obligation to balance short historical sequences.
A theoretical probability table is valuable for education and comparing possible dice totals, but it is not a reliable prediction tool for future independently generated results.
Frequently Asked Questions
What is the minimum K3 total?
The minimum is 3, obtained when all three dice show 1.
What is the maximum K3 total?
The maximum is 18, obtained when all three dice show 6.
How many ordered outcomes are possible with three dice?
There are 216 ordered combinations when each die has six faces.
Which totals have the most possible combinations?
In the standard fair-dice model, totals 10 and 11 each have 27 ordered combinations.
Are totals 3 and 18 equally likely?
Yes, under the fair independent model, each has one ordered combination out of 216.
Can different dice arrangements have the same sum?
Yes. Several combinations of individual dice values can produce identical totals.
Can a K3 total chart predict the next result?
No. It explains theoretical mathematical probabilities rather than guaranteeing an individual outcome.
Conclusion
A K3 dice total chart provides a clear explanation of the possible sums from three six-sided dice. The standard model contains 216 ordered outcomes distributed across totals from 3 to 18, with middle sums having more combinations than the extremes.
Understanding this distribution also helps distinguish combined totals from individual dice values, matching combinations and Odd/Even classifications. The chart is a mathematical reference rather than evidence of future results or the verified probabilities of a particular gaming service.
Disclaimer: JaiClubGame.online is an independent information website and is not officially affiliated with Jai Club. Probabilities assume fair independent six-sided dice and do not represent confirmed platform odds. Real-money gaming involves financial risk and may be restricted or prohibited by applicable laws.